Metrics and insights in GraphOS
Understand your supergraph's usage and performance
GraphOS Studio offers a performant and intuitive UI to help you monitor and understand your supergraph's usage and performance.
Metrics collection and forwarding
To analyze operation metrics in GraphOS Studio, you must first report them to GraphOS. If you have a
If you have a
Apollo also offers a
The following require an
- Connecting a self-hosted router to GraphOS
- Forwarding metrics to Datadog
Reporting metrics from
If your organization
doesn't currently have an Enterprise plan, you can test out this functionality by
signing up for a free
Insights and analysis
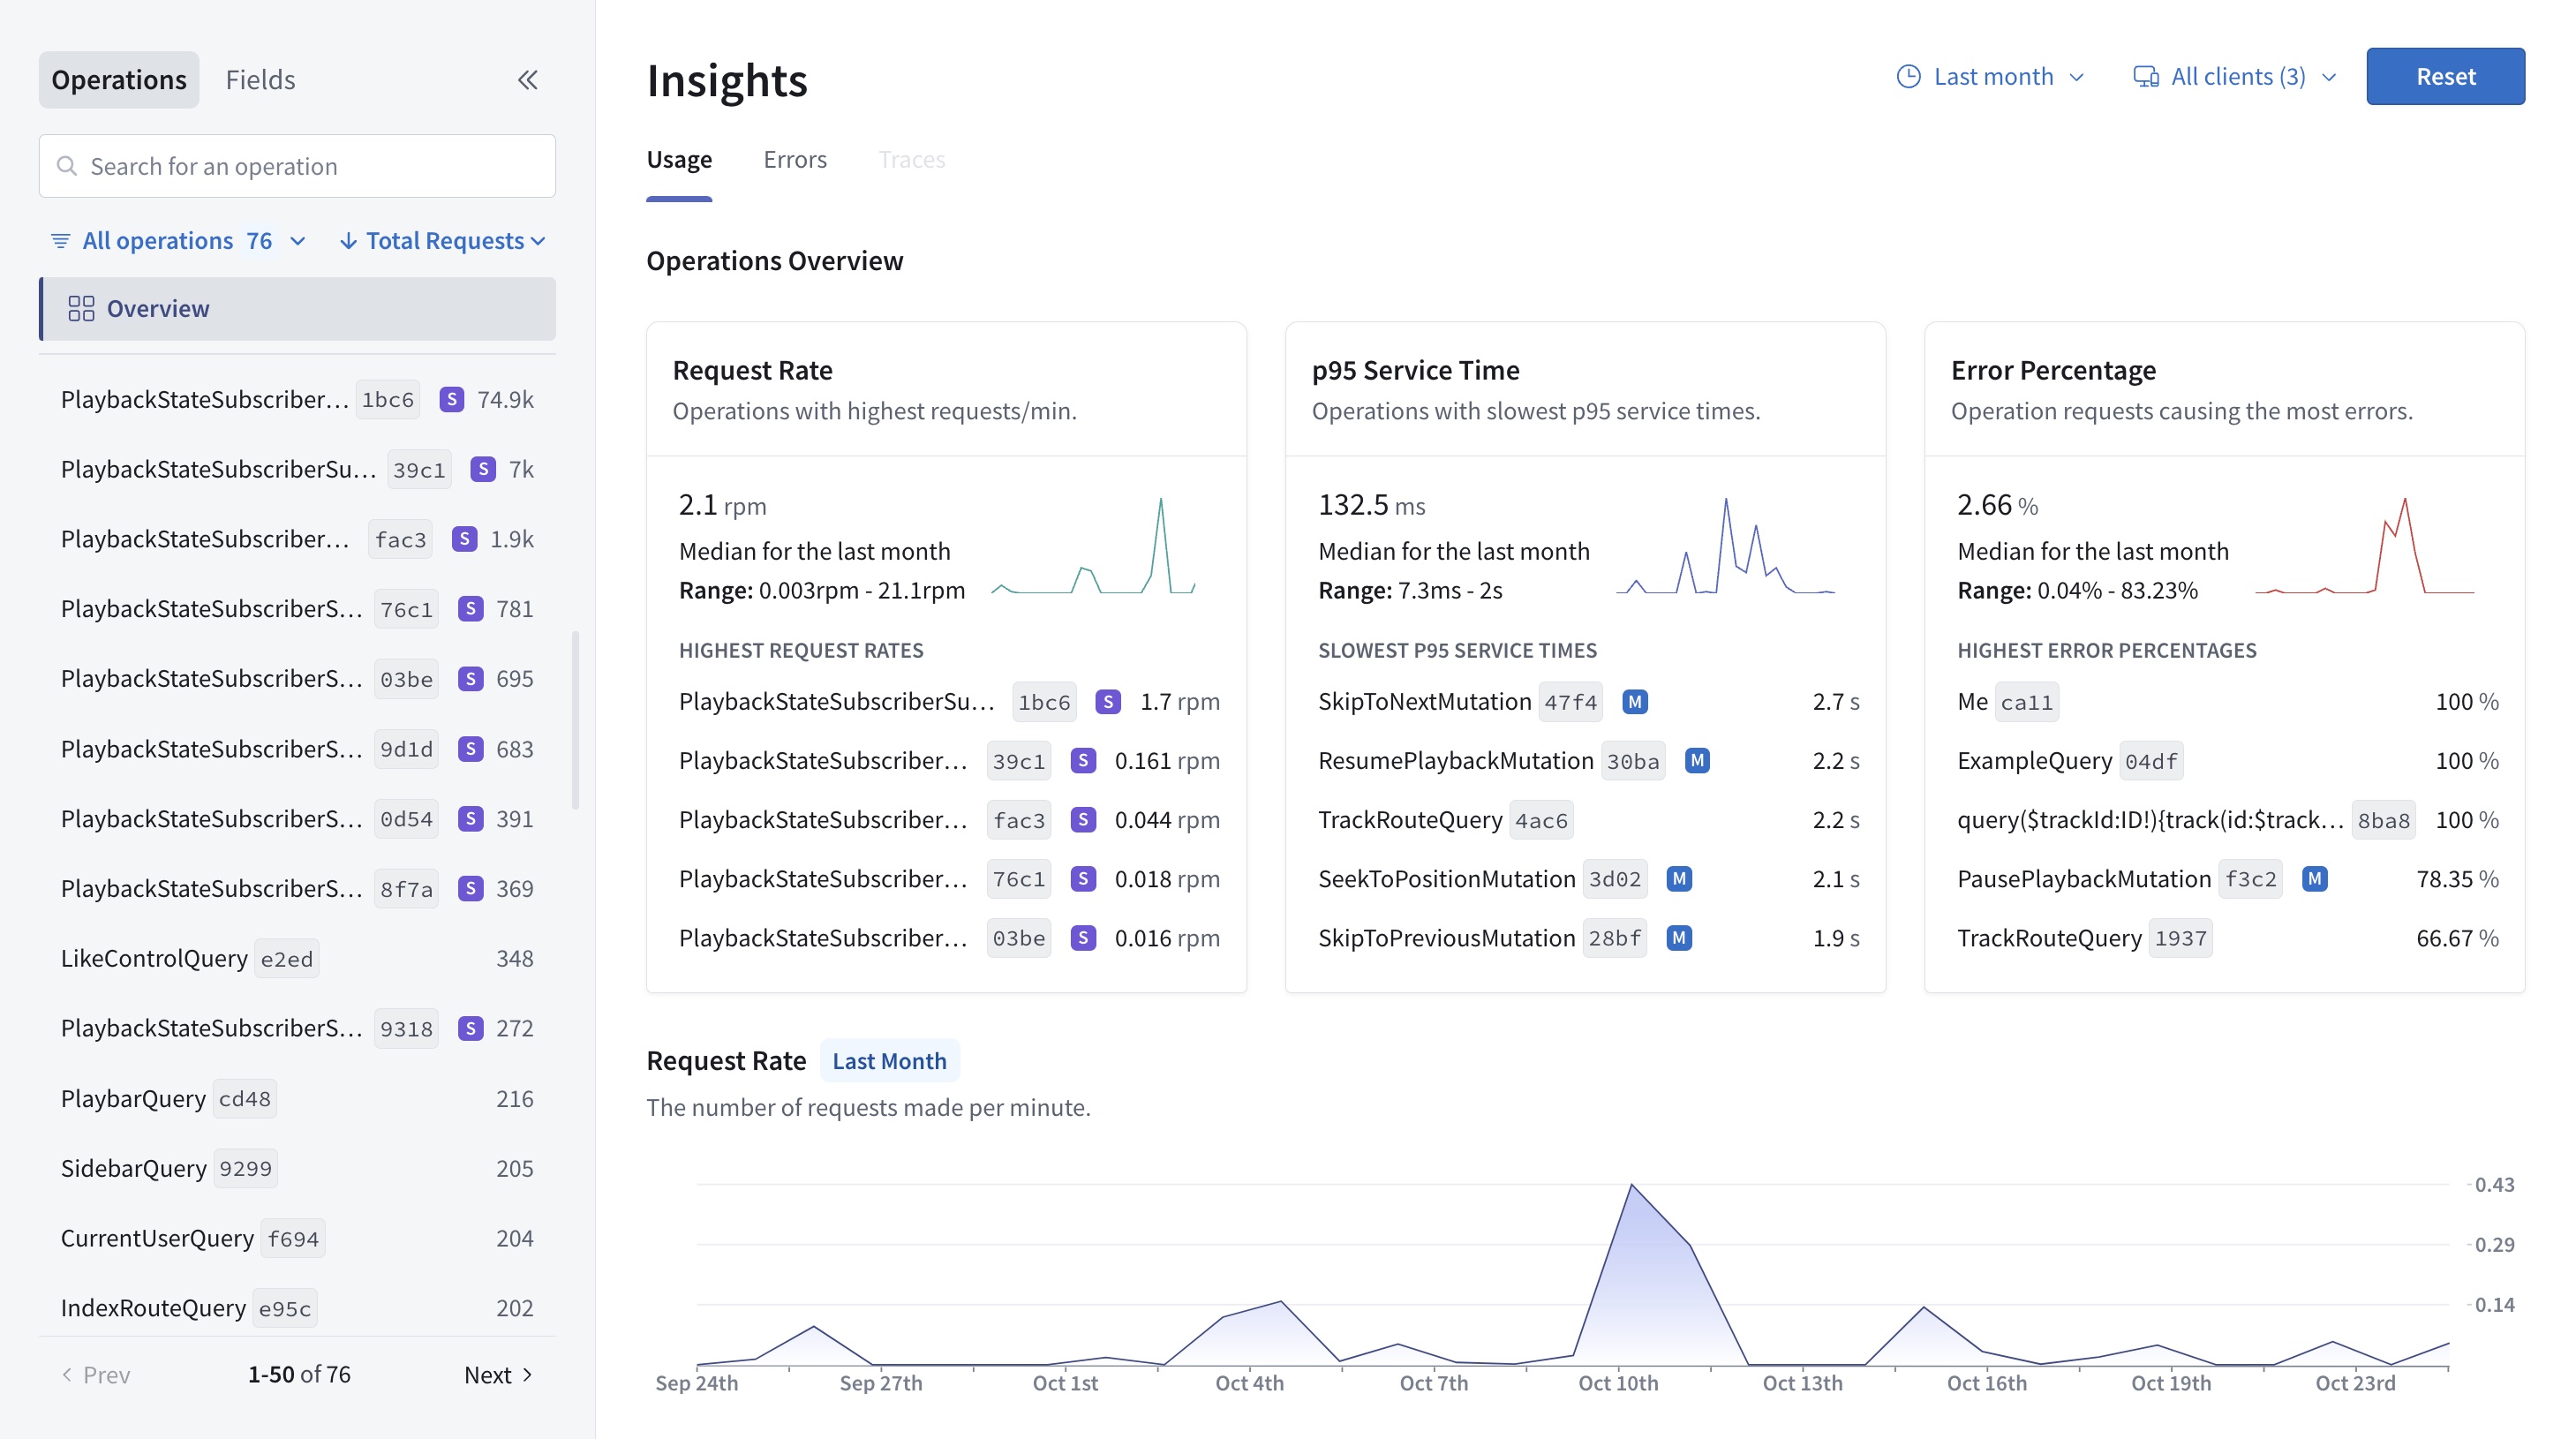
Once you've configured your graph to send operation and field metrics to GraphOS, you can examine them from any variant's Insights page:

The Insights page offers:
- A collapsible left sidebar that acts as a paginated index of your graph's operations and fields, where you can search, filter, and sort operations and fields
- An operations overview where you can adjust the overview's timeframe and filter it to specific clients
- Individual and overall operations performance metrics, including request rate and latency
- Resolver-level traces, if you've configured them
- Field usage metrics
Refer to the
Notifications and alerts
Beyond actively monitoring the Insights page, you can also configure GraphOS to notify your team about changes to your graph and its performance. Check out